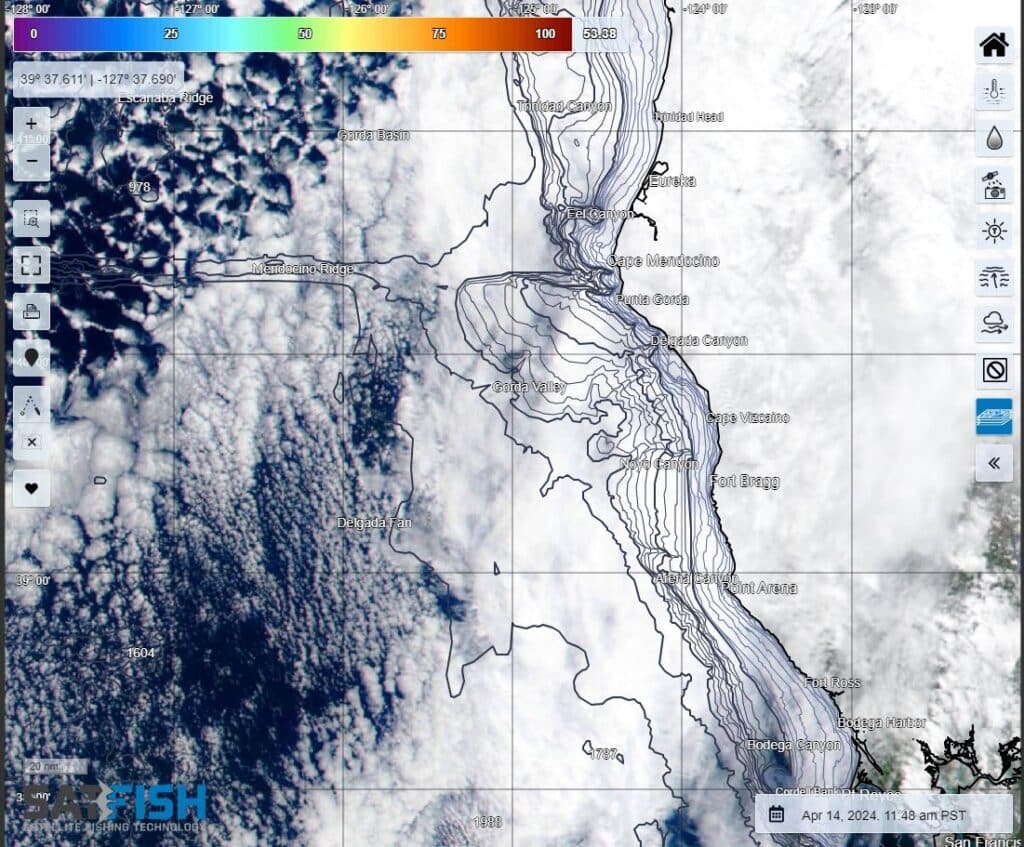
Here on the Pacific coast we have a ton of cloudy days, and they’re usually right when the offshore season is heating up in late spring to early summer. Our “May gray” and “June gloom” overcast conditions regularly spill into July and even August some years, obscuring the high-def satellite data right during our peak months for bluefin tuna, yellowfin tuna, albacore, yellowtail, dorado, and striped marlin.
We’re not about to let a little cloud cover get in the way of our offshore fishing plans, though! SatFish has several tools honed from decades of experience to help you keep track of water temps and breaks until skies clear up again.
Video Link: https://www.youtube.com/watch?v=AGcBoD2DP9o
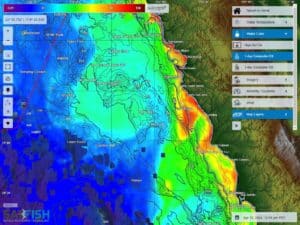
In the video above, Local Knowledge’s Capt. Ali Hussainy breaks down how to use SatFish on cloudy or overcast days when the high-def satellites can’t get a clear view of ocean sea surface temperature or water color. Cloud cover creates “blank” areas where the charts don’t have temperature or chlorophyll data available, which can be a real pain when trying to plan an offshore fishing trip.
Image History Menu with Thumbnail Previews
We provide you with a full archive of the last week’s worth of images for all our satellite-based data layers. Using the calendar icon in the bottom right corner of the map, you can access thumbnail previews complete with date-time stamps for when the image was generated by the satellite passing overhead. The thumbnails give you a quick “at a glance” view of the data coverage available for that image, making it easy to scroll back in time to find when skies were clear and data coverage is more complete.
Most of the time for most regions, using the history menu will help you find an image with good coverage of your target zone within the last 24-48 hours. This will give you a good starting point to find the right temps for your target species as well as any breaks or fronts in the area. Of course, the water moves and changes by the hour, but piecing together info from multiple shots over several days’ time will help give you a rough idea of how quickly conditions are changing and whether they’re likely to still be similar the day you’re out on the water – or how far and which direction the currents might have moved the good water around.
Cloud-Free SST
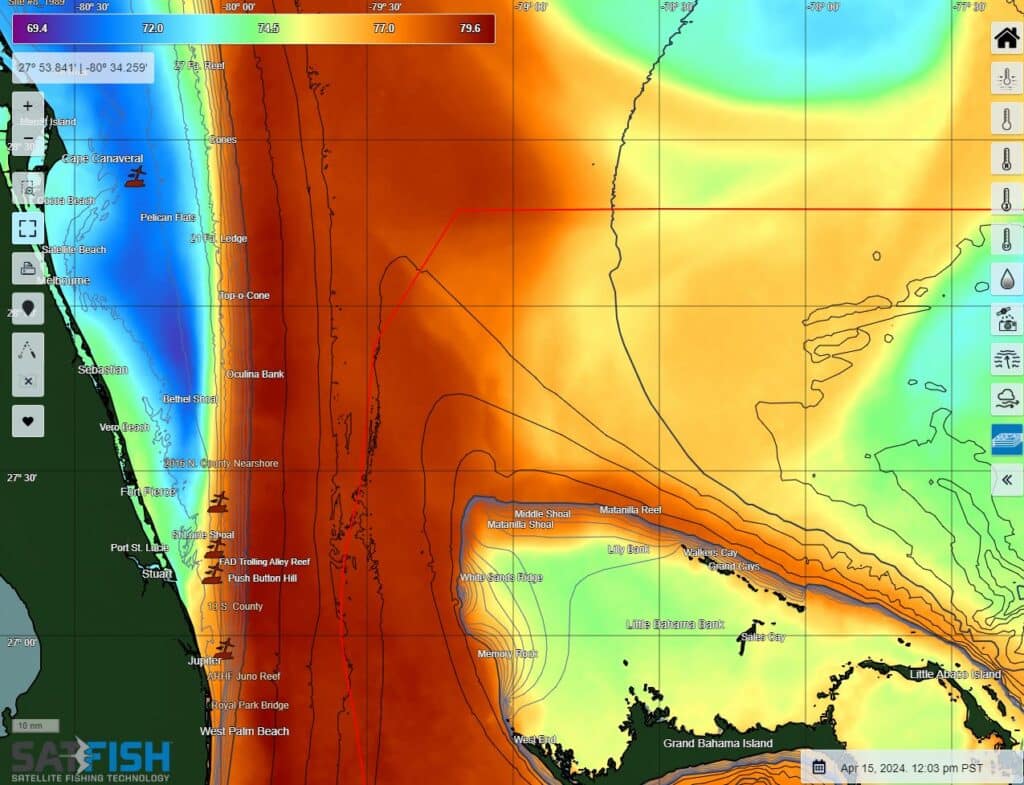
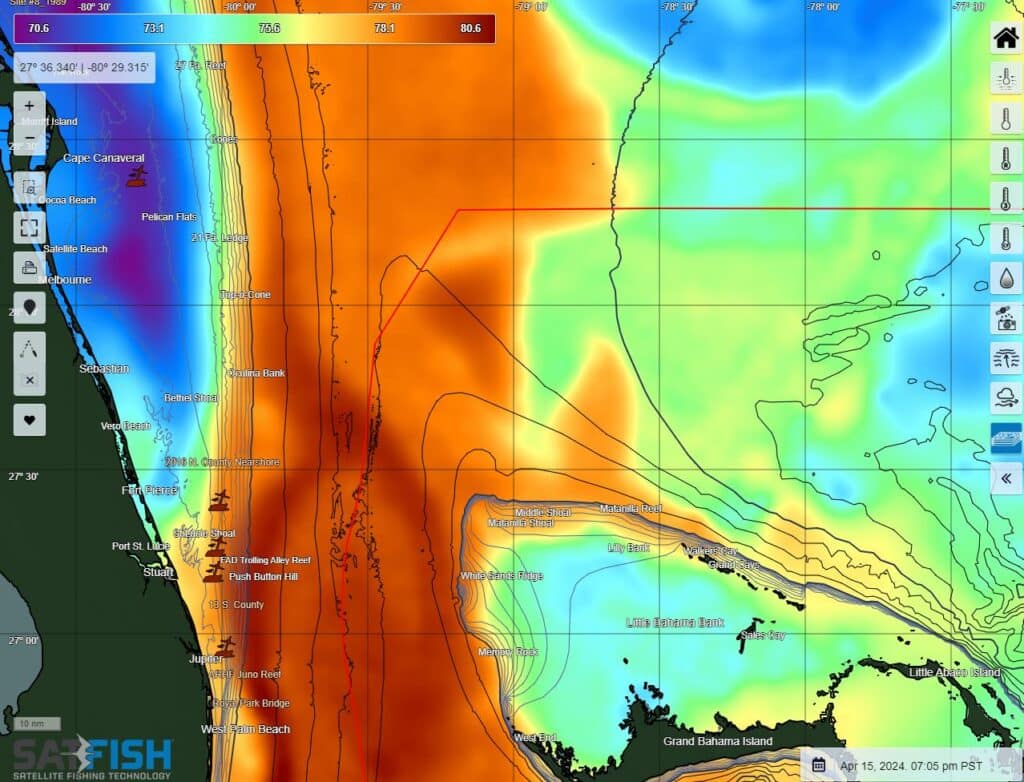
Sometimes it’s just too cloudy for too long to get a good shot even over the course of several days. That’s why we also provide you with a blended-source “cloud free” sea surface temperature layer, updated daily. We won’t go into the details of how it’s made here (you can read more on our cloud-free sst page), but the take-home message is that this layer blends data from low-resolution satellites that can see through clouds with the high-def data from clear-sky areas. The result is a full-coverage general idea of water temps over the “big picture” even when it’s cloudy, with the tradeoff that we won’t be able to see the sharp breaks and edges that the high-def shots provide.
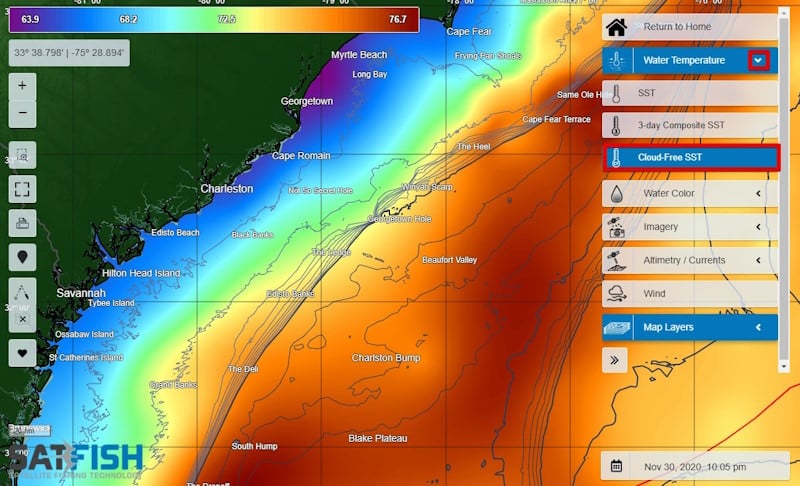
Because the cloud-free layer uses a lot of low-resolution data averaged over large areas, it might seem a little inaccurate or sometimes downright wrong if you compare a single point on the map to what your temp gauge reads out on the water. This is especially true if you’re trying to find the edge of the Gulf Stream, which can sometimes be a 10+ degree jump over less than a mile. That’s not really the best way to use this layer anyway, though – it’s more about visualizing the large-scale oceanographic patterns like cold-core eddies, coastal upwelling, and large meanders in the Gulf Stream that are tens to hundreds of miles in size. The cloud-free SST gives you a rough idea of which way to point the boat and, just as importantly, where not to go because water temps are too cold or too warm.
Multi-day Composites
The other map layers we provide to help you deal with cloud cover are our multi-day composites for sea surface temperature and chlorophyll concentration. These layers use only the high-def satellite data and stitch it together over several days. We offer a 3-day composite SST layer as well as a 1-day and 3-day composite chlorophyll layer, all of which are updated daily.
The 1-day composite chlorophyll layer is just about the best-case scenario for averaging multiple high-def shots into a single image (and this author’s personal favorite). All the satellites that measure chlorophyll pass overhead within 3-4 hours of each other, so any clouds moving through the area will get “averaged out” and the result is a cleaner high-def composite image with maximum available coverage for the day.
The 3-day composite chlorophyll and sst layers take a similar approach, but they feed 3 days’ worth of high-def shots into the averaging algorithm. The result is typically even fuller coverage than the 1-day composite, but it comes with a few risks: first, temp breaks that are on the move tend to get smeared and averaged out, so they disappear from the image completely; and second, there’s a risk it’ll show “phantom” breaks from 3 days ago that have either moved or simply don’t exist anymore. This can fool us into wasting time in a “should have been here yesterday” zone.
By contrast, the lower-resolution Cloud-free SST only uses data from a single day per image. This means that even though it might not show breaks in high-def, at least it won’t show you a phantom break that doesn’t really exist in that spot anymore.

